
Gantt charts have long stood as invaluable tools in project management, providing clear, visual representations of project schedules and allowing team members to understand their tasks and deadlines clearly. In this article, we explore the diverse applications of Gantt charts, highlighting their adaptability and effectiveness in various contexts.
Understanding the Basic Structure of a Gantt Chart
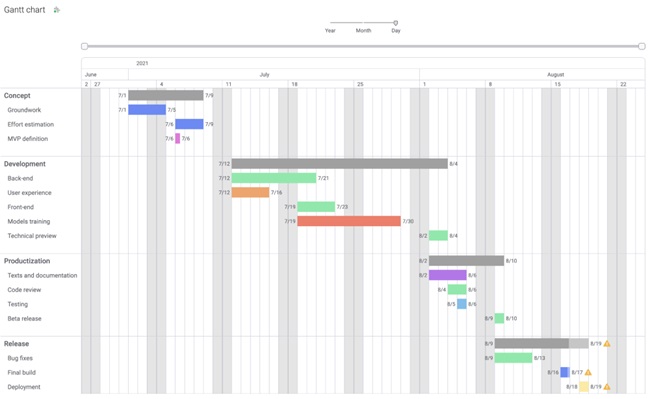
Before delving into the applications of Gantt charts, let’s first understand their basic structure. Henry Gantt, a mechanical engineer and management consultant, developed the Gantt chart in the early 20th century. The vertical axis represents the tasks that make up the project, while the horizontal axis represents time. Bars of different lengths represent the duration of each task.
The positioning and length of each bar reflect the scheduled start and end time of each task. Horizontal arrows represent dependencies between tasks. Understanding the basic structure of a Gantt chart is crucial to leveraging its full potential in project management. Taking a look at some examples of Gantt chart visualizations, you can see how beneficial they can be for task management.
Transparency is another significant advantage of Gantt charts. They provide an overview of tasks, including their sequence and duration, thereby reducing misunderstandings or communication gaps. They also enable teams to identify and manage resource allocation, ensuring maximized efficiency and preventing burnout or resource wastage.
The timeline is positioned based on the duration of each task. Project managers can decide on the unit of measurement that most accurately reflects their project needs, ranging from minutes to months, even years, if necessary. Apart from showing the task length, it also indicates the task’s start and end dates, hence providing a clear temporal mapping for the duration of the project. This aids in setting realistic timelines and adequately managing resources, thereby upping the project success ratio.
Leveraging Gantt Charts for Effective Project Planning
Proper planning is a critical component of project management, and this is where Gantt charts excel. Plots of project tasks on a timeline allow managers to visualize the entire project schedule. They can determine the sequence of tasks and the duration of each task and spot potential bottlenecks ahead of time.
Furthermore, Gantt charts give project managers a strategic view of the entire project. With this view, strategic shifts or adjustments are easier to make and communicate. The visual nature of Gantt charts also makes them accessible and understandable, even to stakeholders not intimately familiar with the project’s details.
With the use of software tools, today’s Gantt charts have become interactive, making planning and scheduling even more efficient. Tasks can easily be adjusted or shifted, reflecting changes in real-time and ensuring that every team member and stakeholder has the most recent project information at their fingertips.
Using Gantt Charts for Resource Management

At their core, Gantt charts are visual tools that unravel the complex web of task management, making resource allocation and management easier and more efficient. By clearly laying out the scope and sequence of a project, Gantt charts help teams understand what resources—be they human or material—are required at which stages of the project.
Gantt charts also make overflows or shortages apparent early on in the process. This foresight enables the project manager to mitigate these risks, perhaps by redistributing resources or adjusting the schedule. The net effect is more efficient resource usage and potentially significant cost savings.
Furthermore, Gantt charts can play a crucial role in balancing workloads among team members. By visually representing who is supposed to do what and when, they reveal if some team members are overburdened and others underutilized, allowing managers to redistribute tasks if necessary.
Evaluating Project Progress and Success with Gantt Charts
By plotting the plan versus the reality, Gantt charts serve as an excellent tool for measuring and evaluating project progress. They allow project managers to immediately see if tasks are lagging behind schedule or if resources aren’t being utilized as planned. This constant monitoring can trigger corrective actions before minor issues escalate into substantial problems.
Gantt charts also facilitate a post-project review process. Comparing the planned timeline with the actual timeline reveals areas where the project management team excelled and where they can improve in future projects. These learnings are invaluable in refining processes for future projects.
Moreover, Gantt charts can serve as a historical record of projects, providing concrete data points for future project planning and predictions. When planning similar projects in the future, project managers can refer back to these Gantt charts to assist in estimating task duration and resource allocation.
Overall, understanding and utilizing Gantt charts is a step towards clearer communication, better planning, and successful project execution. Gantt charts can increase team collaboration and contribute to employee satisfaction. The potential of Gantt charts extends far beyond mere scheduling—they are powerful project management tools that can significantly enhance productivity and success rates.


Comments